

RIMAP
RITEC Integrated Machinery Analysis Package
In today’s fast-paced industrial environment, leveraging advanced software solutions is essential for optimizing machine performance and ensuring operational efficiency.
Our software offers a range of benefits designed to enhance the monitoring and management of critical machinery
Real-Time Monitoring enables the use of wireless sensors to continuously track machine health, granting analysts immediate access to vital performance data. This feature allows for proactive maintenance and timely interventions, reducing downtime and enhancing productivity.
Furthermore, our Open-Source Database Compatibility ensures seamless integration with various open-source databases, providing users with unmatched flexibility and accessibility. This capability allows organizations to tailor their data management solutions to their specific needs.
The software also boasts Versatile Data Visualization, displaying sensor readings in multiple formats, such as waterfall and spectrum views. This feature facilitates comprehensive analysis, enabling users to gain deeper insights into machine performance and identify potential issues more effectively.
Finally, our Customizable Reporting feature empowers users to generate detailed reports that can be edited and formatted according to individual preferences. This ensures that relevant information is readily accessible, supporting informed decision-making and strategic planning.
Together, these features create a robust framework for enhancing operational efficiency and driving continuous improvement in industrial settings.
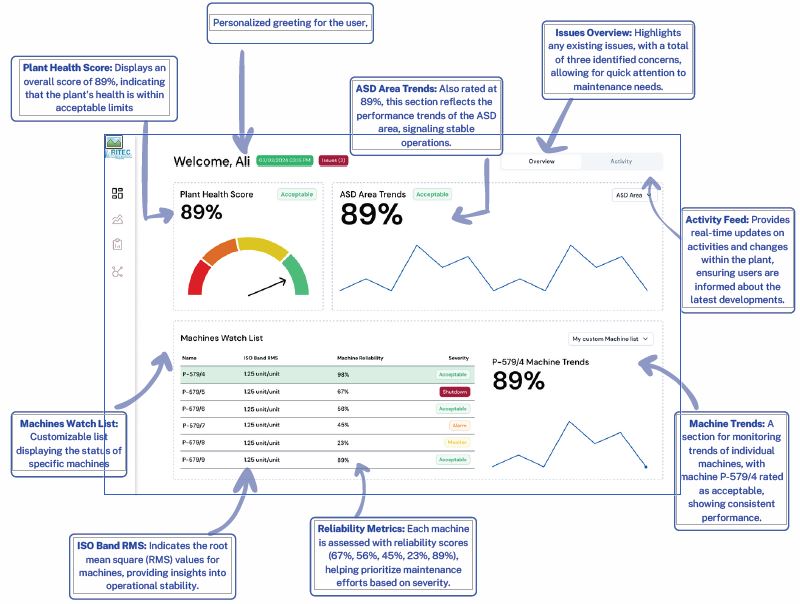
The dashboard provides a comprehensive overview of plant health and machine performance metrics, enabling users to monitor operational efficiency effectively.
The dashboard is designed to facilitate proactive management of plant operations, enabling users to make informed decisions based on real-time data and trends.
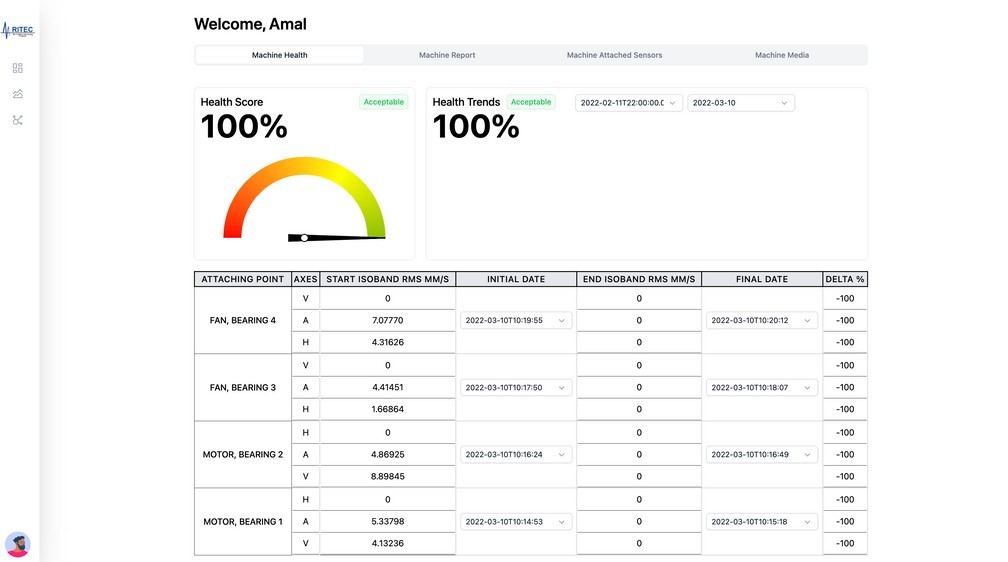
Each machine has its own machine dashboard that provides a comprehensive overview of machine health and performance metrics, enabling users to monitor operational efficiency effectively
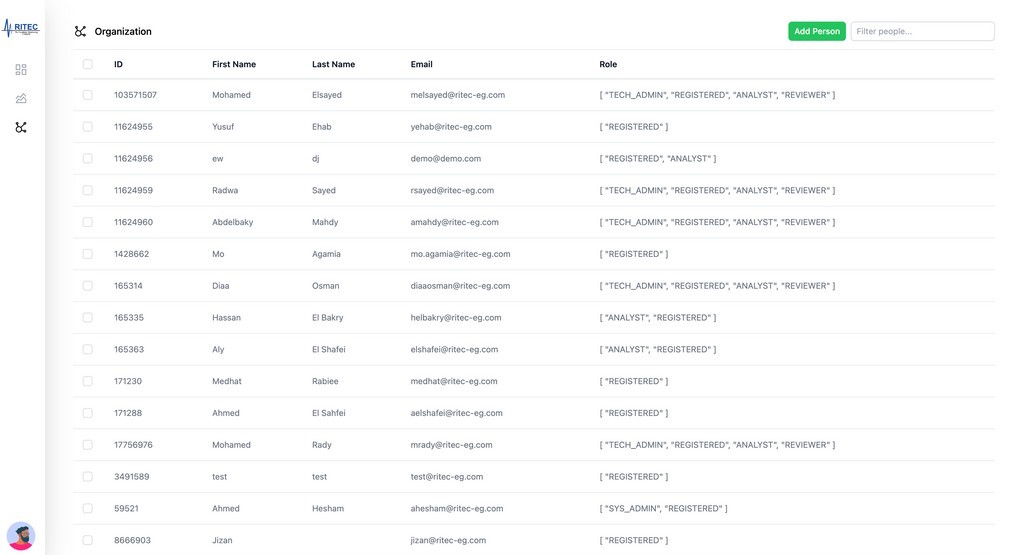
Create Unlimited Users:
Allows you to onboard as many users as needed, ensuring your team can collaborate seamlessly without restrictions.
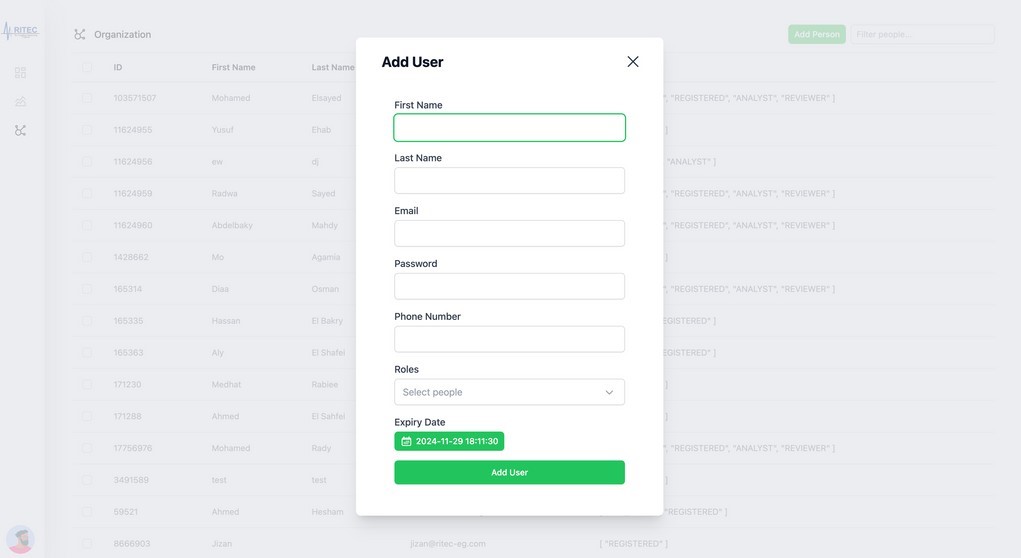
Set Privileges and Roles:
Enables customization of user access levels, allowing you to assign specific roles and privileges to enhance security and streamline operations.
As RIMAP enables engineers and machine analysts to diagnose and monitor machines. It has a special hierarchy consisting of 4 components: Plant, Area, Machine, Sensor.
Each added component will have a status circle next to it, which tells the status without the need to fetch all the graphs of the sensor.
Adding or removing a component can be done from the sidebar. Each add/remove button has a special functionality as follows:
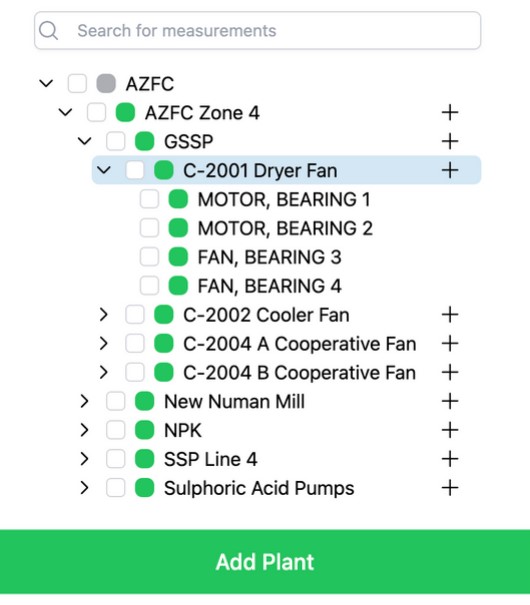
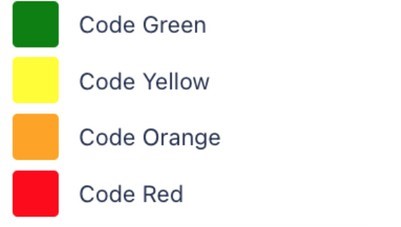
Each component has a color code that indicates its status.
The color code is mainly for the sensor but each machine has multiple sensors, so the machine color code is indicated by the worst color code of its sensors.
The same goes for the area, the area color code is indicated by the worst color code of its machines and the same for plant.
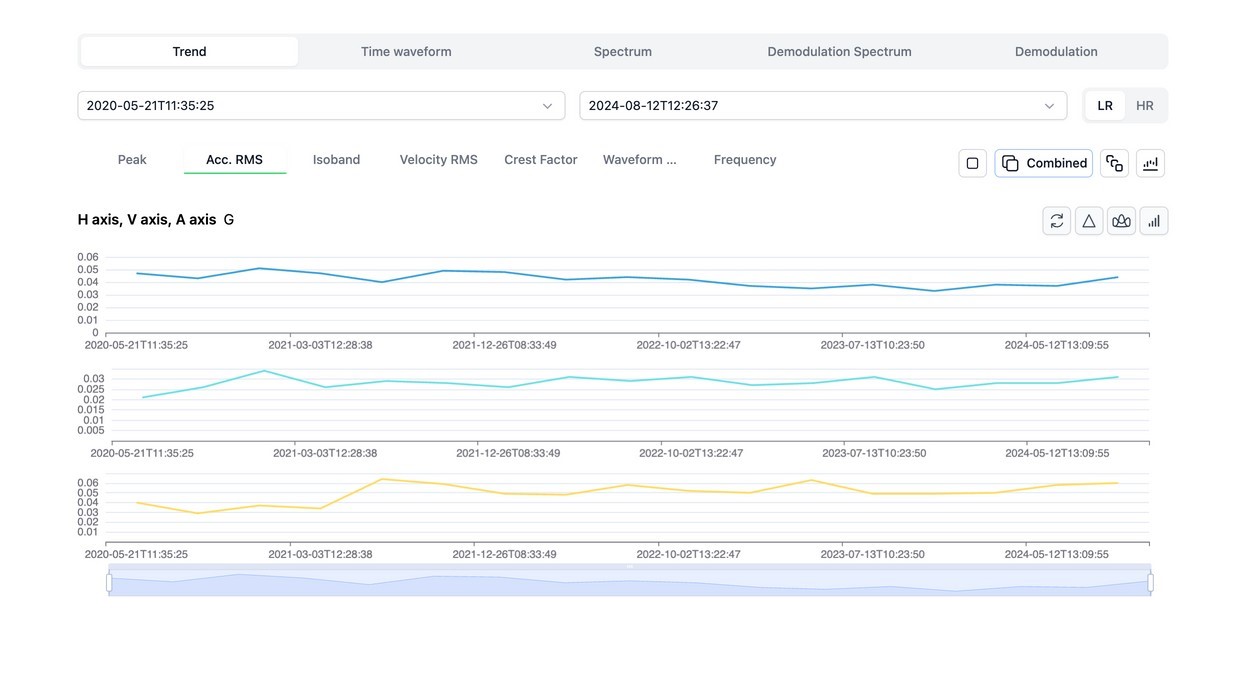
Trend view enables monitoring different vibration paramters (Peak value, Acceleration RMS, Isoband , Velocity RMS, Crest factor, customizable single frequency trend).
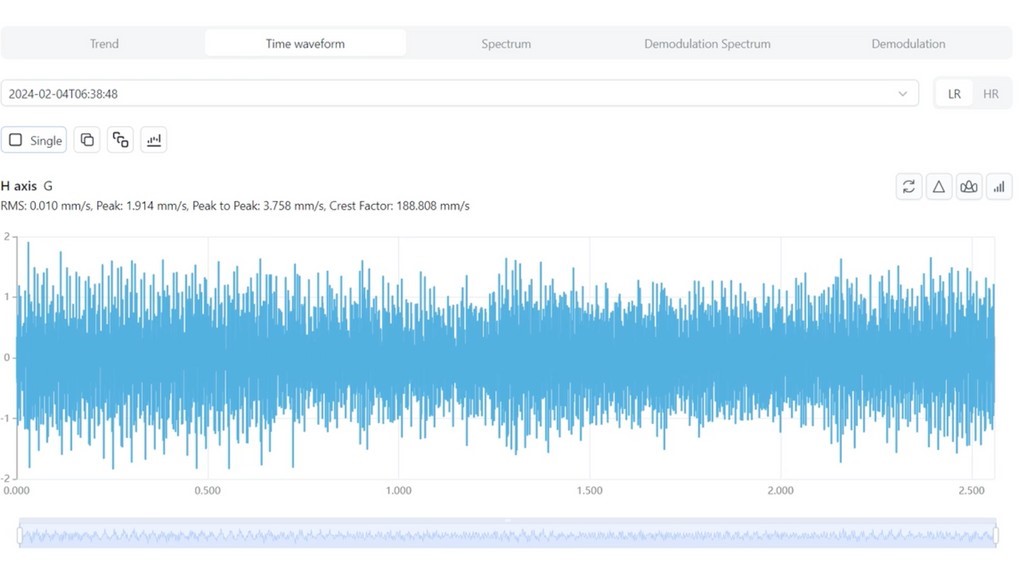
Time waveform display the time domain from vibration sensor with customizable viewing options (single direction view , combined view for the 3 directions or superimposed display), in addition to different cursor options (eg: difference between different peaks or marking repeated peaks) and customizable units display.
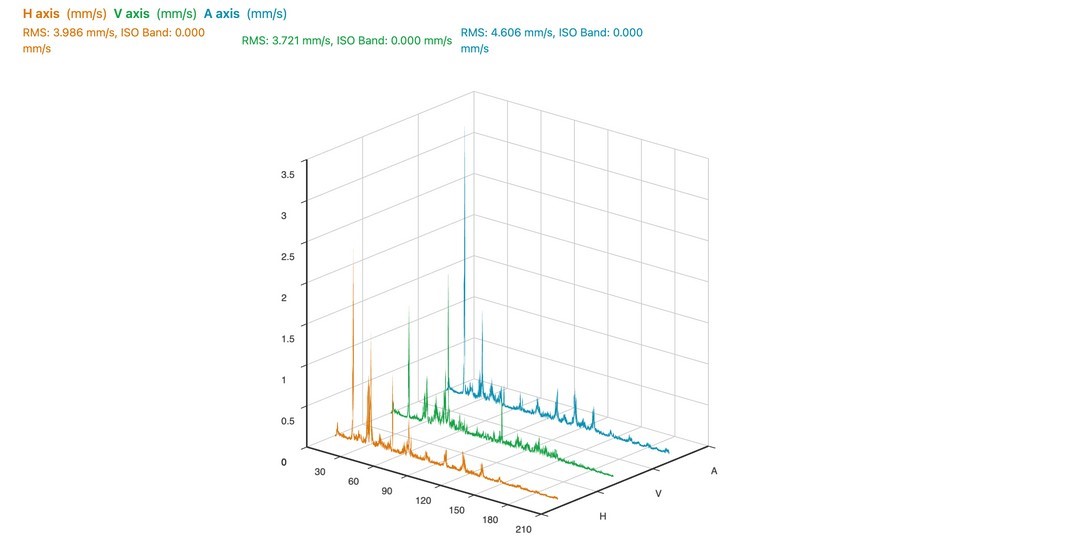
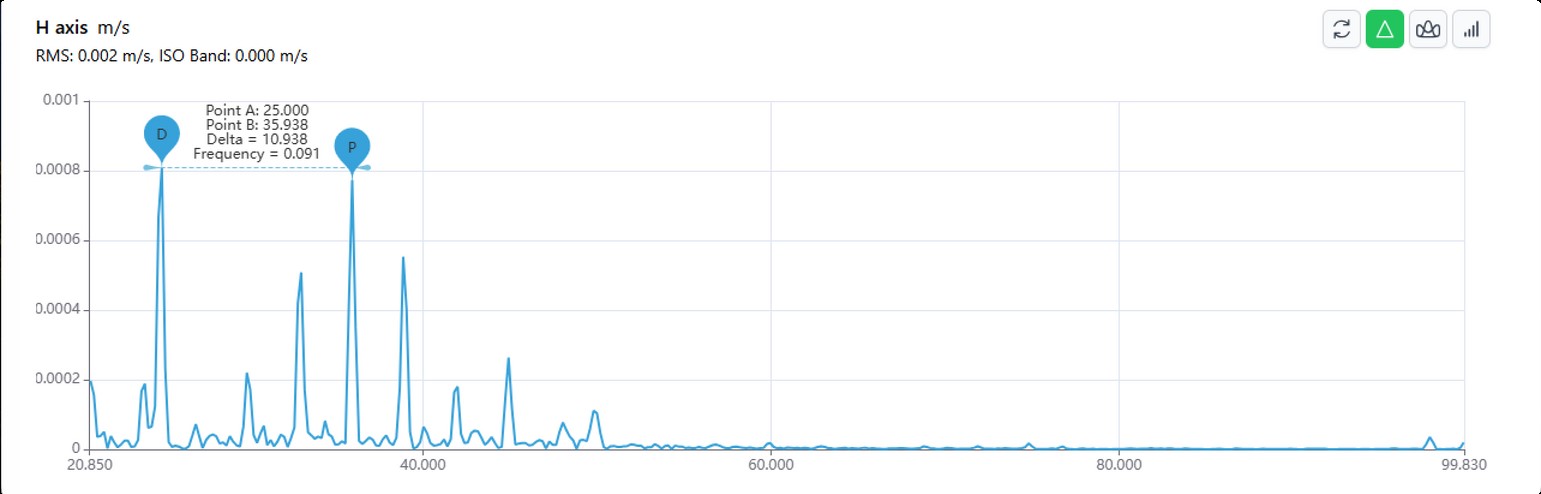
Spectrum display for FFT frequency domain spectra from vibration sensors with customizable units and customizable view (single direction spectrum, combined view for the 3 directions, superimposed view or waterfall spectra for different dates).
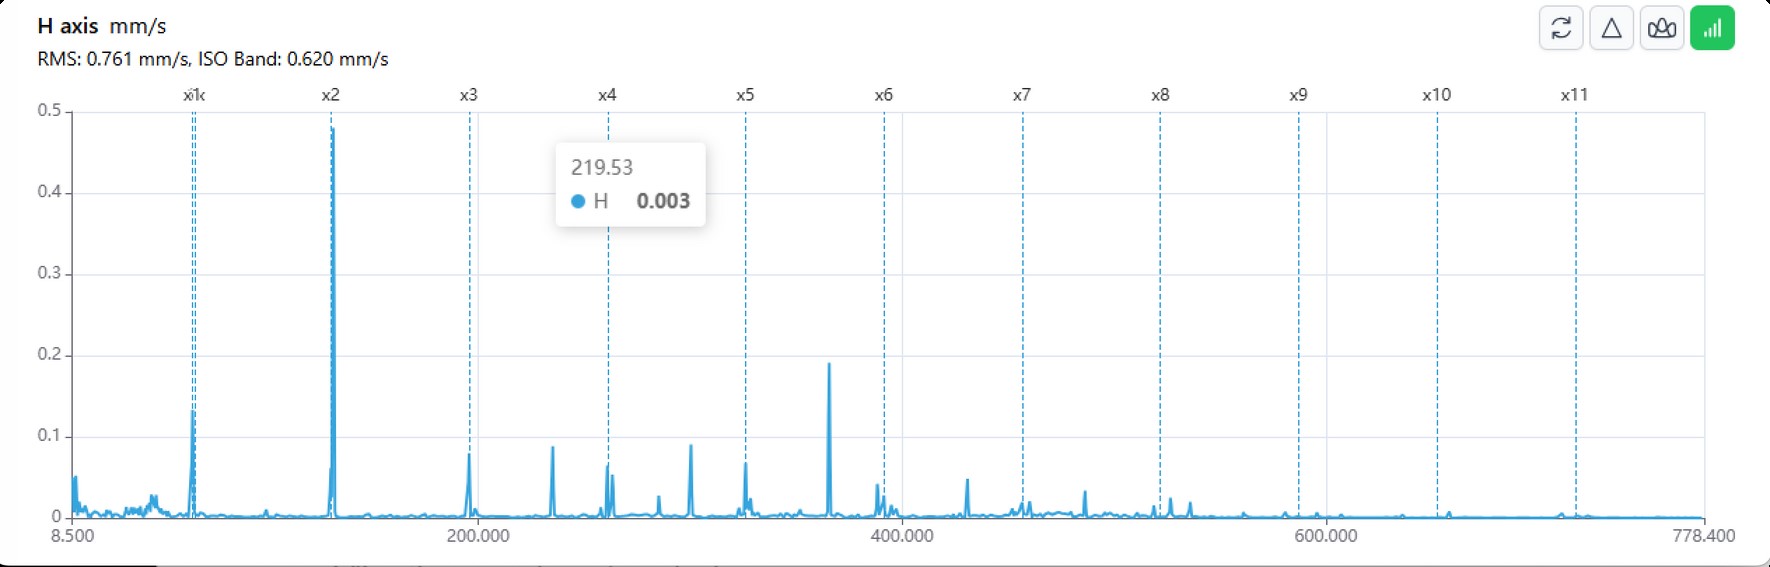
In addition to helping cursor tools like harmonics markers , sidebands markers and difference between 2 frequencies.
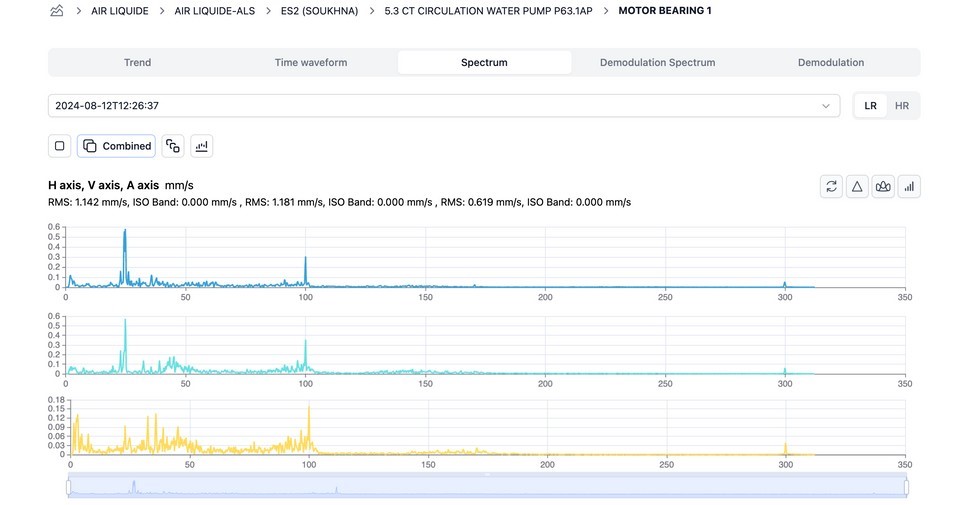
It is possible to view the waterfall of a full machine or single location spectra at different date range.
Each graphs page consists of 3 graphs: Horizontal (H Axis), Vertical (V Axis) and Axial (A Axis). These axes can be viewedin different modes.

There are also other tools (markers) that can control each graph:

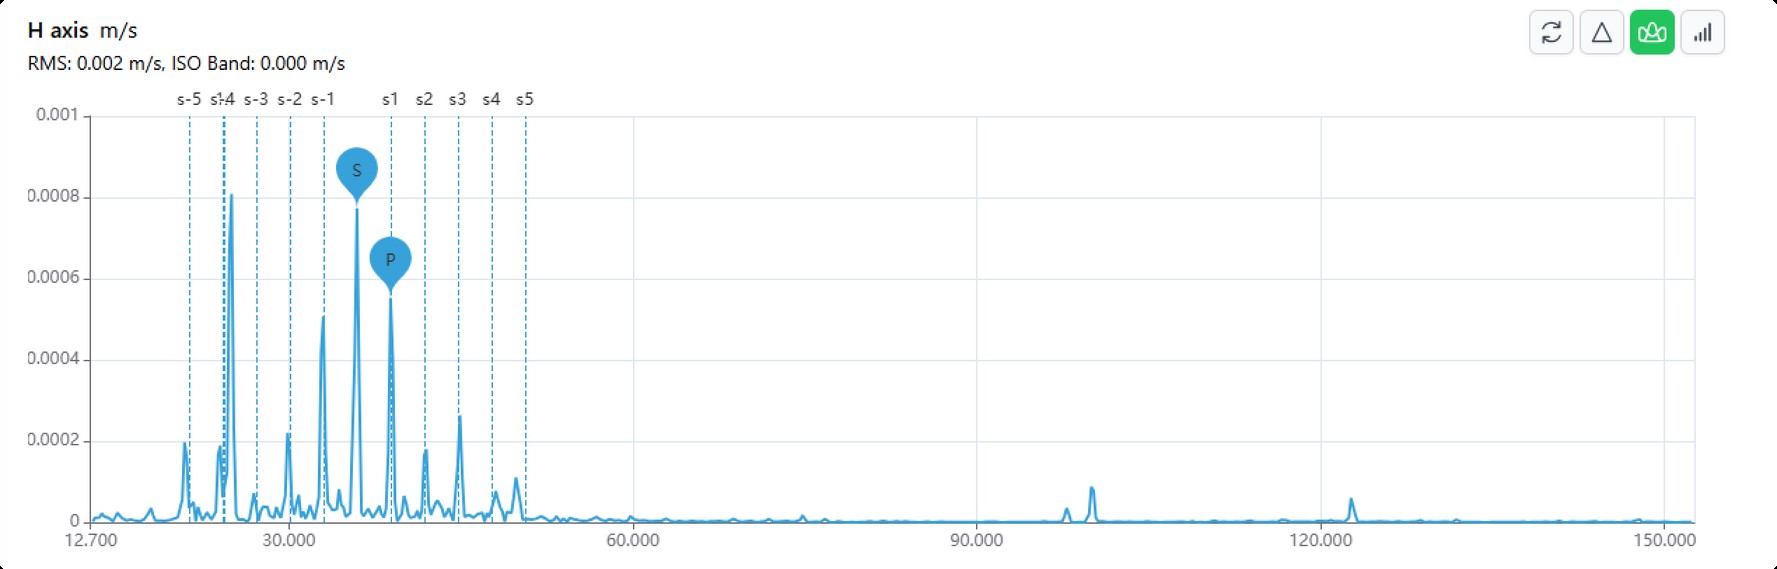
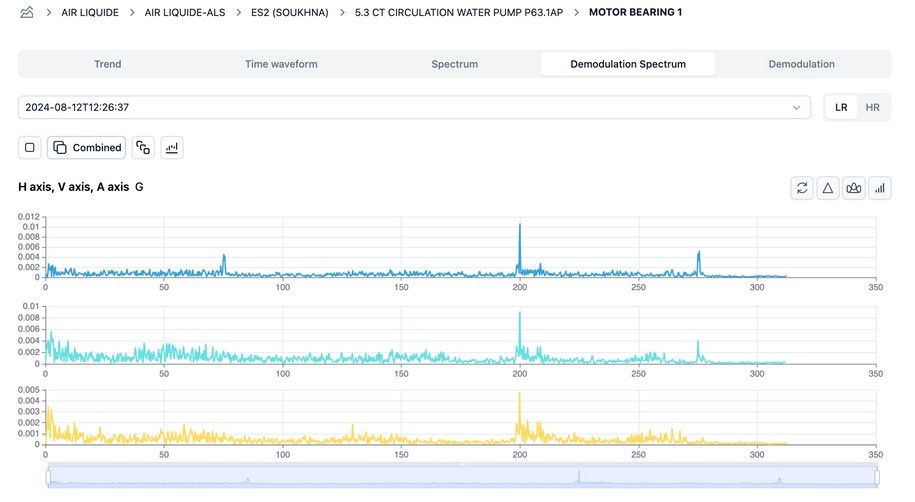
Demodulation view shows either demodulation time waveform or demodulation spectrum to detect bearings defects.
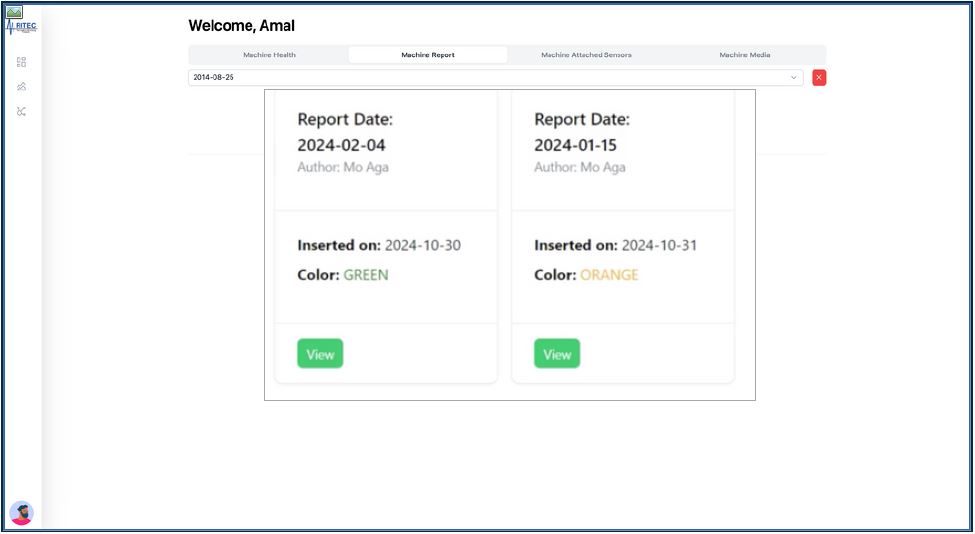
The Report History feature enables users to easily access and review previously created reports. This functionality provides a comprehensive overview of the user's past submissions, allowing for efficient tracking and retrieval of historical data.
Key aspects of the Report History feature include:
This feature is designed to streamline the reporting process, ensuring that users have quick access to their reporting history for ongoing analysis and reference.
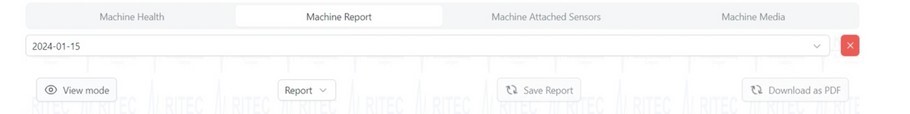
The report section provides an overview of the vibration data collected from the monitored equipment. Key metrics such as the date of the report, equipment identification, and overall vibration levels are highlighted for quick reference.
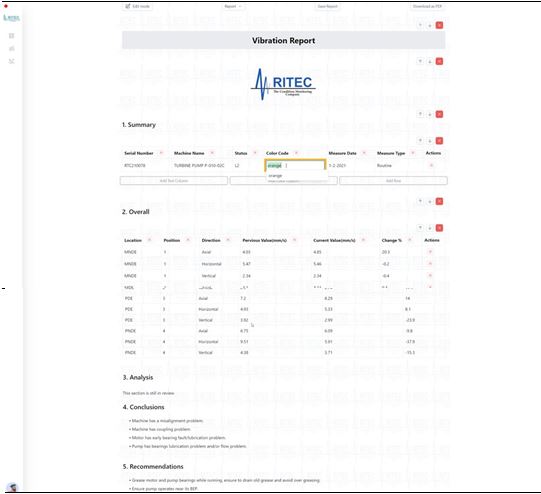
Addition to this analysts can save reports as drafts, enabling analysts to revisit and finalize the document at a later time.
This feature ensures that no data is lost during the reporting process.
Also, sections order can be rearranged according to user preference.
This flexibility allows users to present information in a manner that best suits their analytical approach and audience.
Finally, addition to the main features, analysts can view and export previously created reports that allows use.
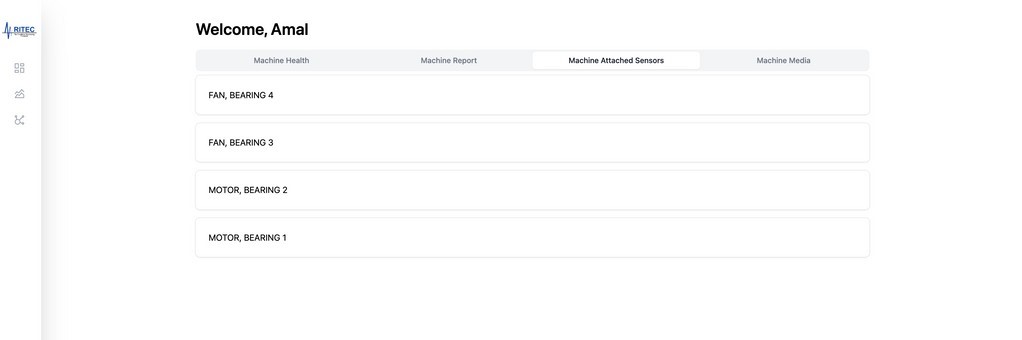
This feature allows analysts to view and manage all sensors attached to a specific machine. Analysts can easily monitor sensor data in real-time, ensuring comprehensive insights into machine performance and health.
By providing a centralized view of all attached sensors, this functionality enhances the ability to track various parameters, such as temperature, vibration, and pressure, facilitating proactive maintenance and timely decision-making. This promotes operational efficiency and optimizes machine reliability.
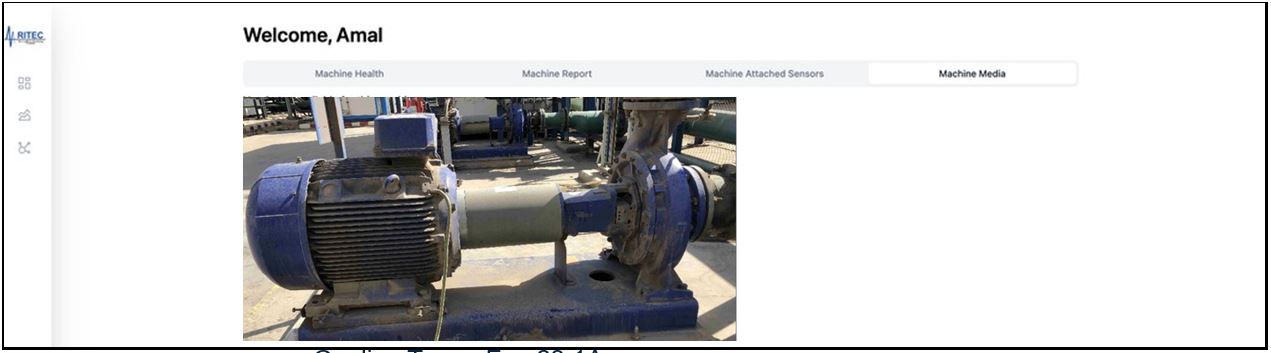
This feature enables analysts to easily add and associate media files, such as images, videos, and documents, to specific machines within the system.
By providing a visual and contextual reference for each machine, this functionality enhances understanding and facilitates better decision-making regarding maintenance and performance. Analysts can access critical information quickly, improving the overall efficiency of machine monitoring and diagnostics.
Our cutting-edge asset monitoring software is designed to seamlessly integrate with your existing computerized maintenance management systems (CMMS) like SAP system. This integration aims to enhance asset management , streamline automated maintenance processes , and improve overall operational efficiency.
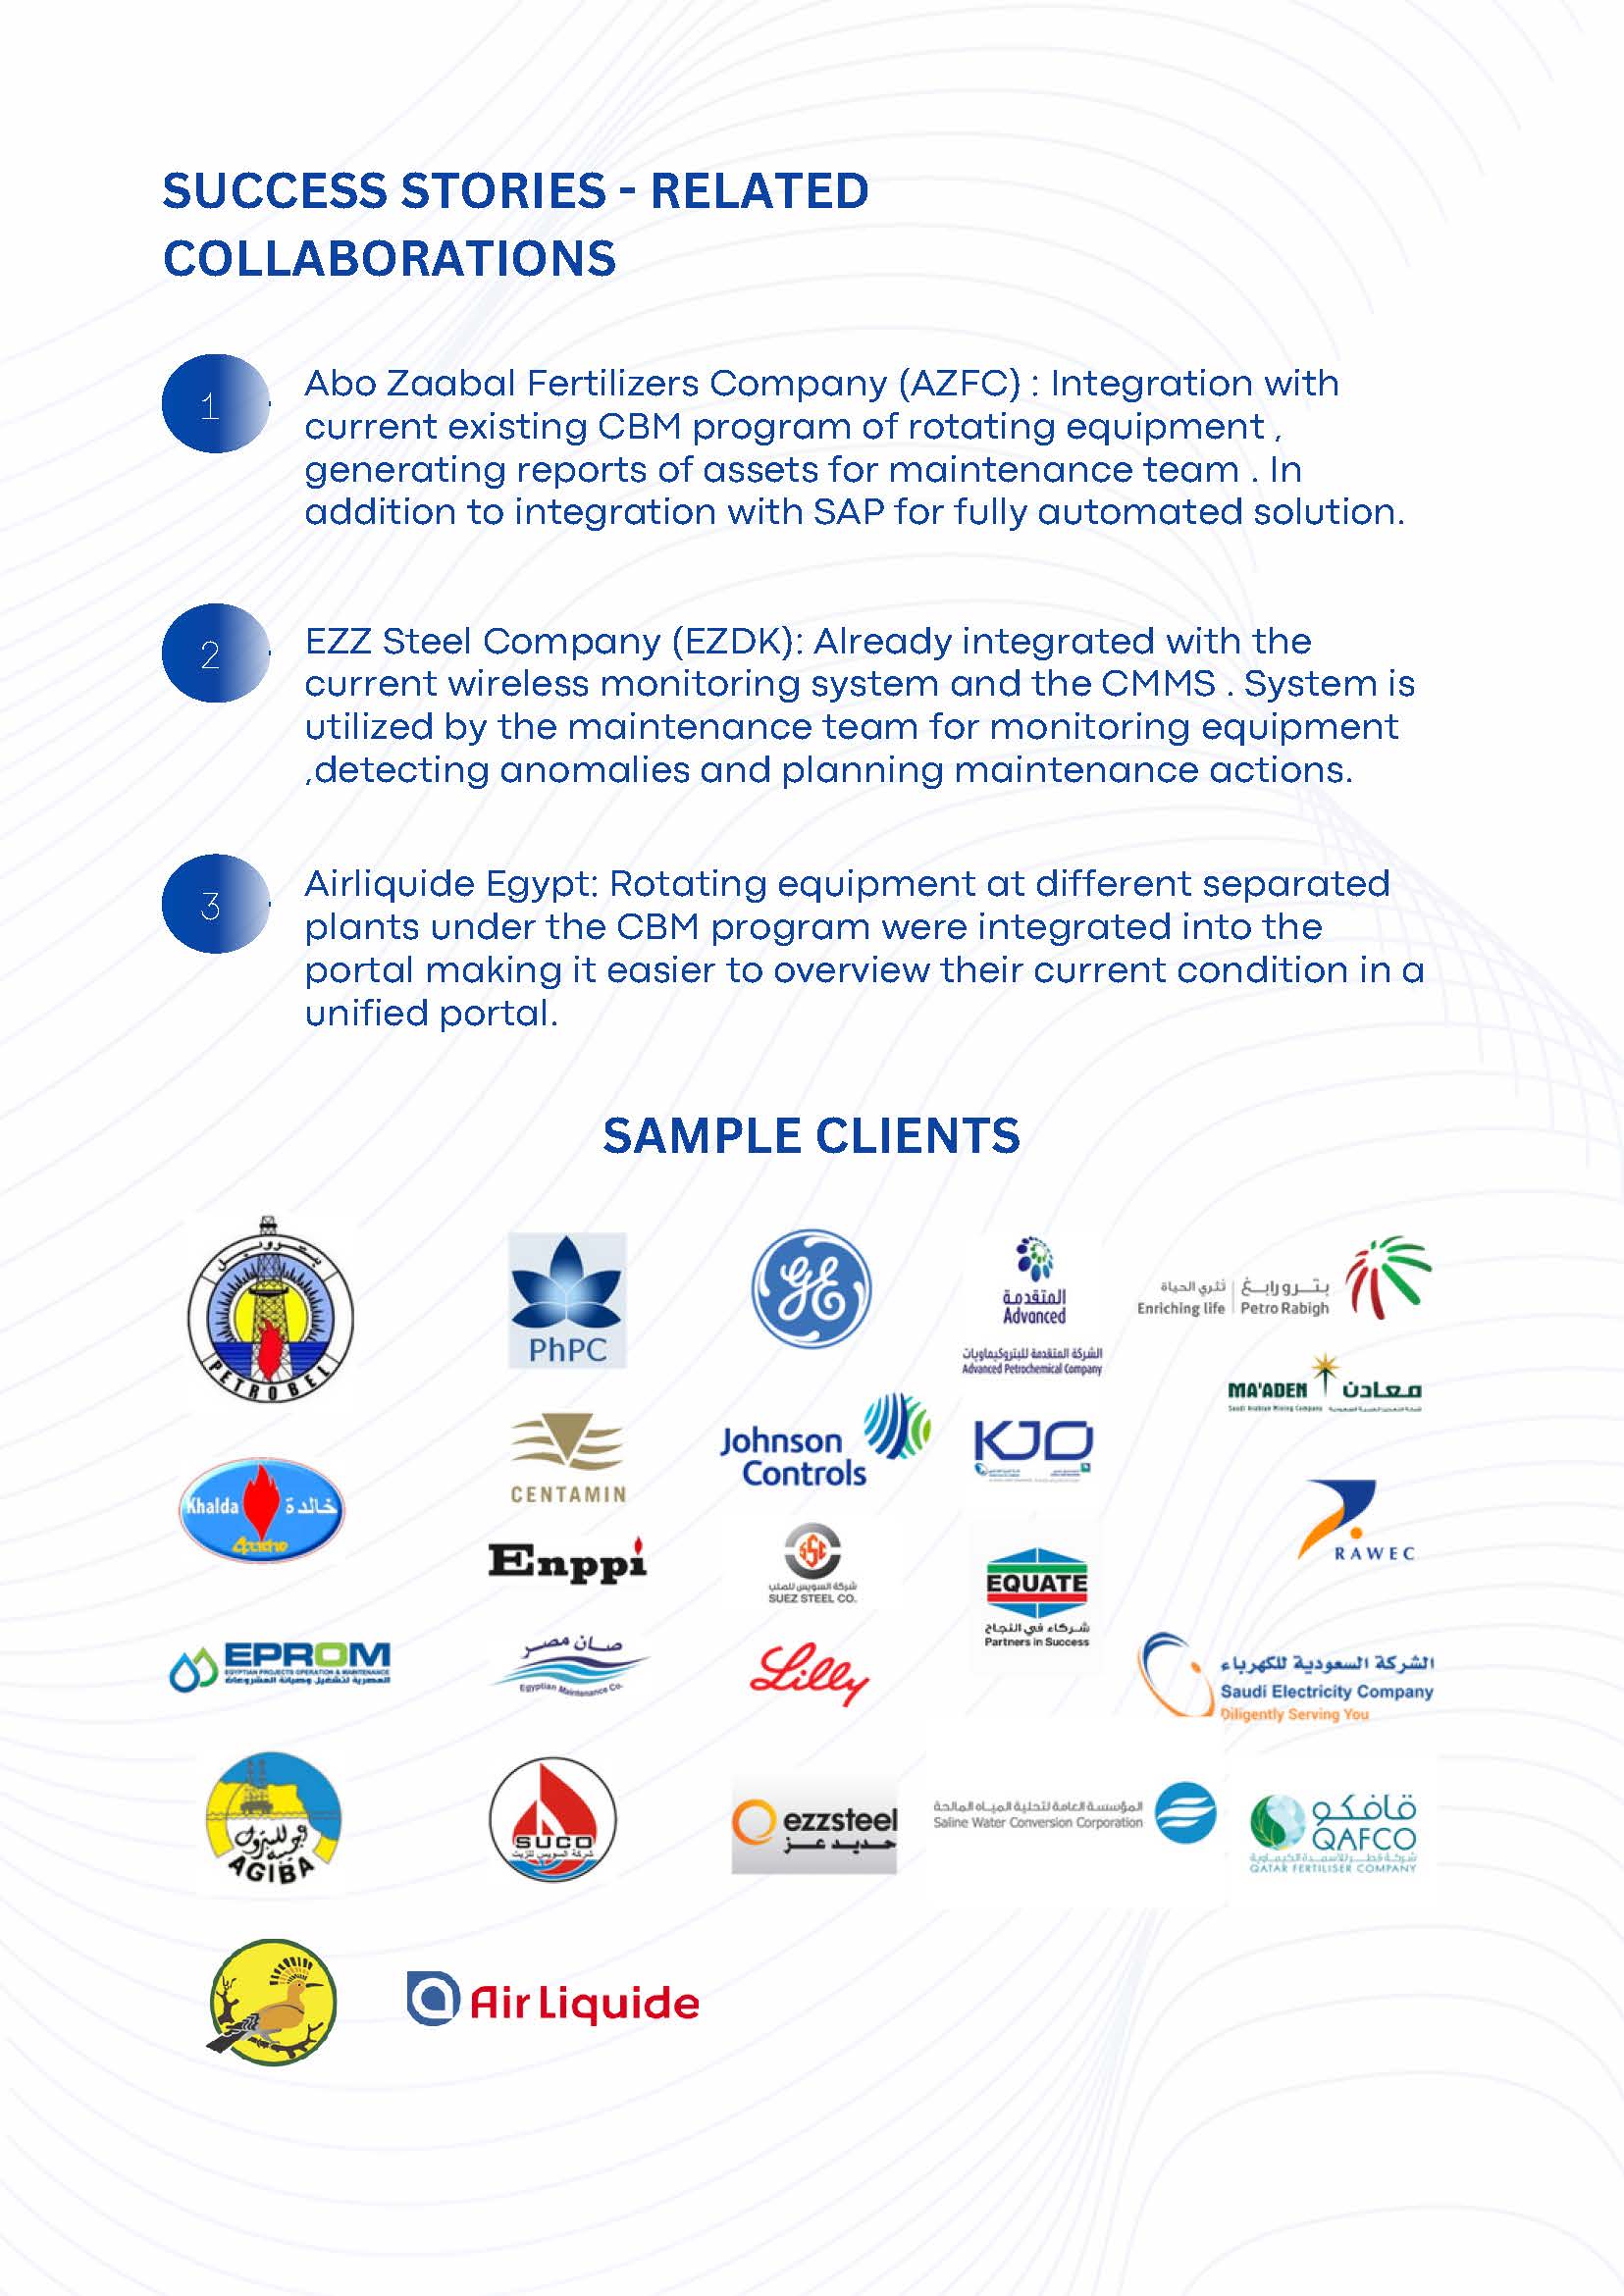
We succeeded to integrate our system in Ezz steel company proprietary CMMS system and are currently implementing the integration with SAP system in Abu Zaabal Fertilizers Company AZFC . This is done by communicating our software APIs with SAP system. The integration will enable the reflection of real time conditions into the SAP system and taking relevant actions in an automated process as below color code of machine status:
Moreover, we are able to communicate our recommended actions to the SAP system to facilitate work order generation.
Rimap provides unparalleled value for your operations by enabling analysts to monitor machine health across your facilities through an intuitive dashboard. Here are key benefits:
Online Monitoring Monitor its own condition monitoring/assets integrity programs at multiple sites in different countries.
Seamless Integration Open architecture to collect data from multiple sensors / gateways / databases and to interface seamlessly with CMMS systems including those that are part of an ERP system.
24/7 Support At RIMAP, we are committed to providing exceptional service to our customers. That's why we offer 24/7 support to ensure that you have assistance whenever you need it.